Data Interpretation – ugc net june-2020 question papers solved paper-1
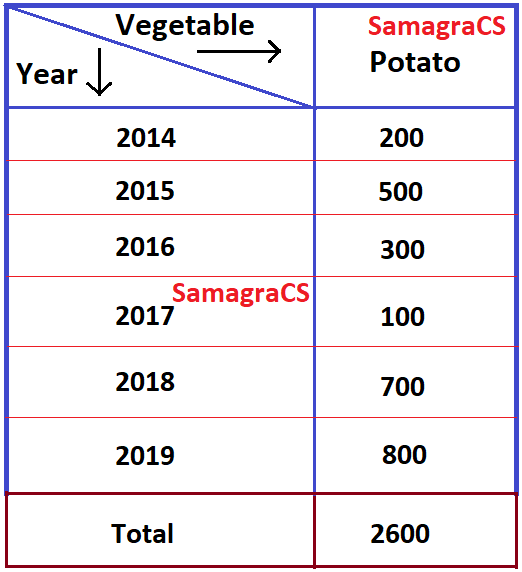
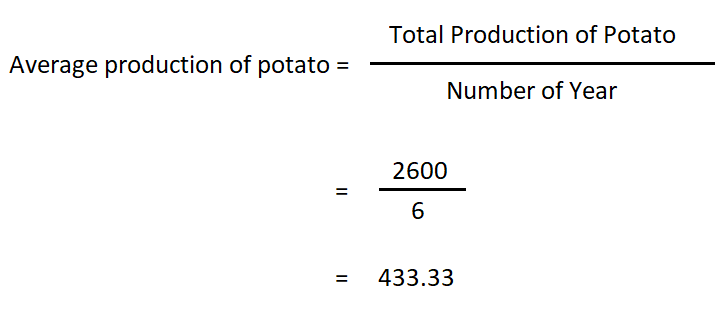
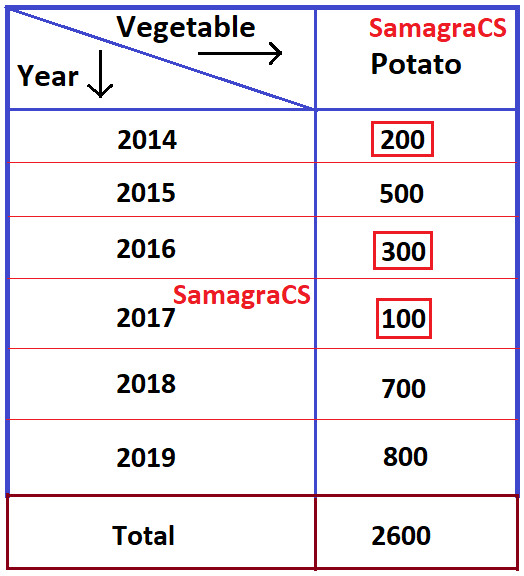
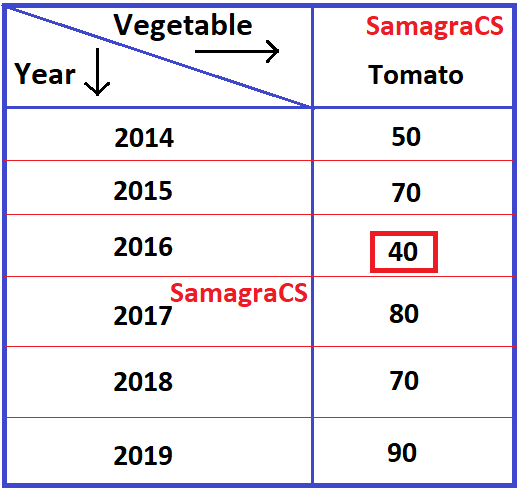
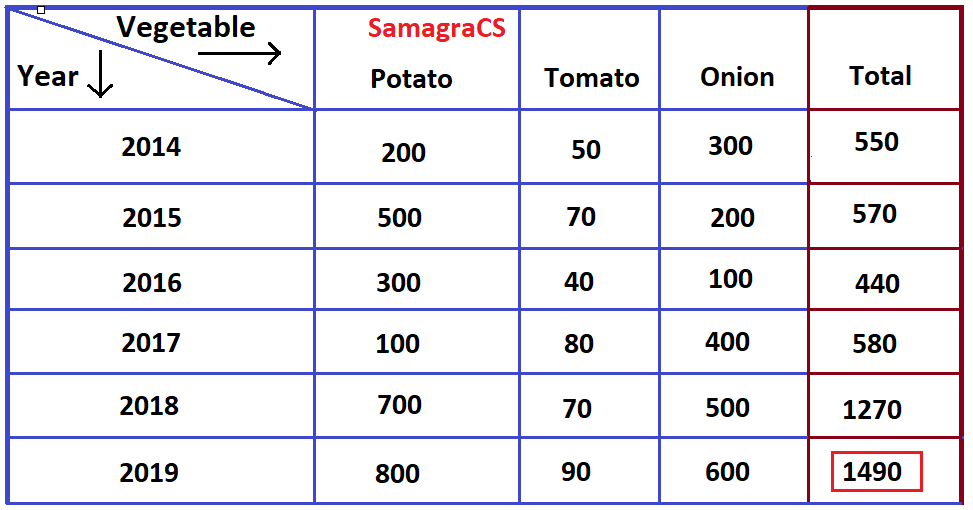
| Q1➡ | UGC NET November 2020, 24 sept shift 1 Q1 To 5 comprehension The following table embodies the data on vegetables produced year wise in tonne for a particular district. 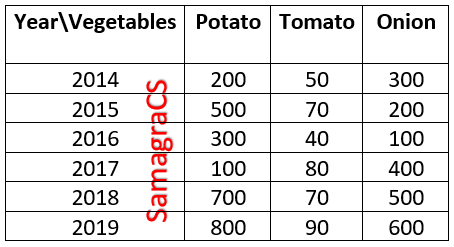 In which year (s) the production of potato is less than that of average production? A. 2016 B. 2014 C. 2015 D. 2017 Choose the correct answer from the options given below. |
| i ➥ A and B only |
| ii ➥ A,B, and D only |
| iii ➥ C only |
| iv ➥ C and D only |
Show Answer With Best Explanation
| Q2➡ | UGC NET November 2020, 24 sept shift 1 Q1 To 5 comprehension The following table embodies the data on vegetables produced year wise in tonne for a particular district. In which year (s) the production of tomato the least? |
| i ➥ 2014 |
| ii ➥ 2017 |
| iii ➥ 2019 |
| iv ➥ 2016 |
Show Answer With Best Explanation
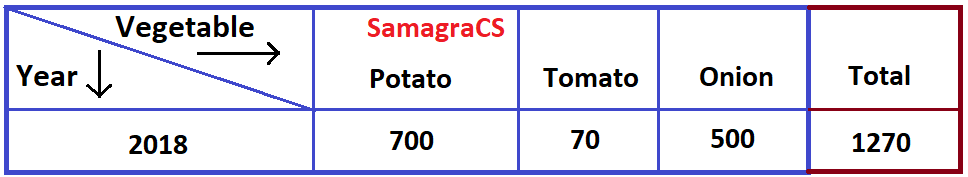
| Q3➡ | UGC NET November 2020, 24 sept shift 1 Q1 To 5 comprehension The following table embodies the data on vegetables produced year wise in tonne for a particular district. what is the gross production of vegetables in the year 2018? |
| i ➥ 1270 |
| ii ➥ 1275 |
| iii ➥ 1260 |
| iv ➥ 1280 |
Show Answer With Best Explanation
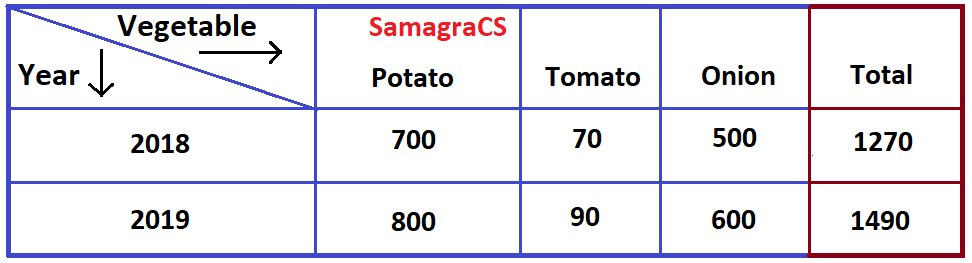
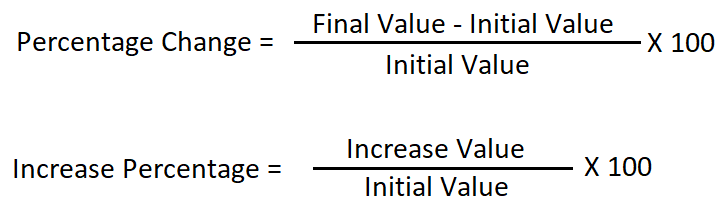
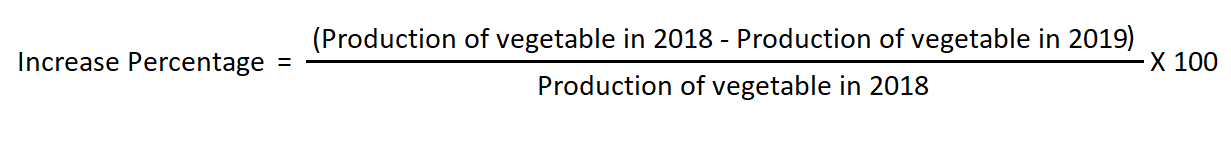
| Q4➡ | UGC NET November 2020, 24 sept shift 1 Q1 To 5 comprehension The following table embodies the data on vegetables produced year wise in tonne for a particular district. what is the increase( in percentage )of the production of vegetables from the year 2018 to 2019? |
| i ➥ 15.7% |
| ii ➥ 16.1 % |
| iii ➥ 19.4 % |
| iv ➥ 17.2 % |
Show Answer With Best Explanation
| Q5➡ | UGC NET November 2020, 24 sept shift 1 Q1 To 5 comprehension The following table embodies the data on vegetables produced year wise in tonne for a particular district. In which year the productivity of vegetables is maximum? |
| i ➥ 2018 |
| ii ➥ 2016 |
| iii ➥ 2019 |
| iv ➥ 2017 |
Show Answer With Best Explanation
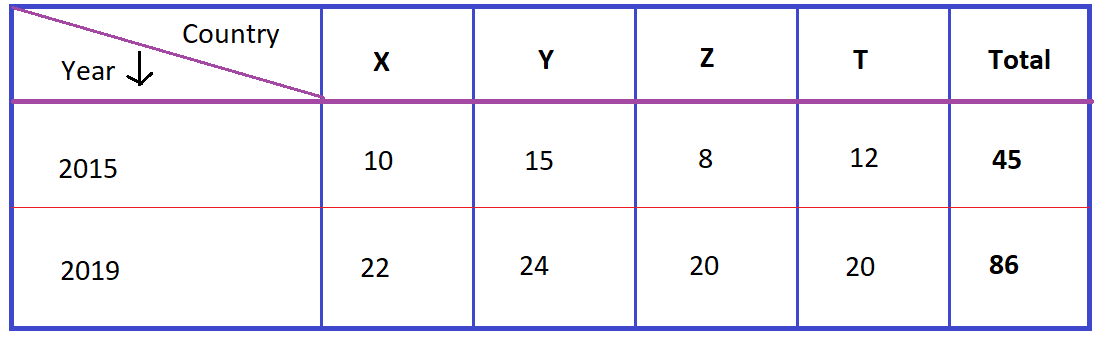
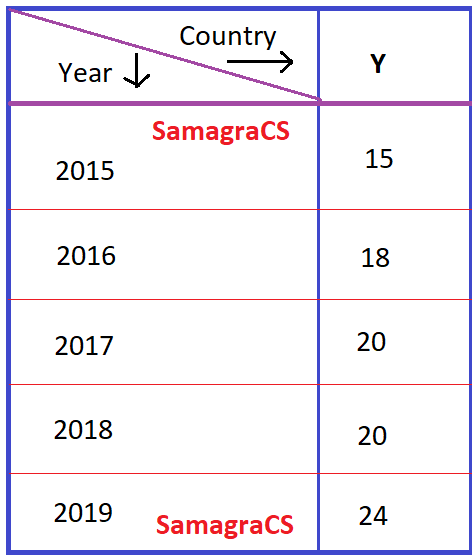
| Q6➡ | UGC NET November 2020, 24 sept shift 2 Comprehension: Ques. 6 To 10 Based on the data in the table, answer the questions that follow Consider the following table which contains year-wise data of installed Renewable Energy capacity for four countries (X, Y, Z, T) over a period of 5 years from 2015 to 2019. 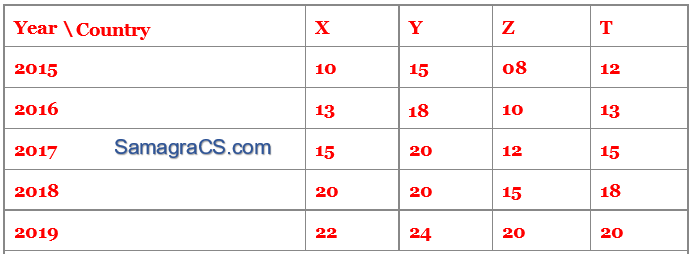 Q6➡ Taking all four countries together, what is over-all increase (%) in installed capacity of Reneable Energy in the year 2019, with reference to 2015? |
| i ➥ 52. 32 % |
| ii ➥ 91.11 % |
| iii ➥ 117.32 % |
| iv ➥ 121.81 % |
Show Answer With Best Explanation

| More Discussion | Explanation On YouTube | Learn Topic Wise | Help-Line |
| Q7➡ | UGC NET November 2020, 24 sept shift 2 For the country ‘Y’ , what is the average annual growth (%) of Renewable Energy capacity? |
| i ➥ ~10.85 % |
| ii ➥ ~12.77 % |
| iii ➥ ~13.25 % |
| iv ➥ ~11.65 % |
Show Answer With Best Explanation
More Discussion | Explanation On YouTube | Learn Topic Wise | Help-Line |
| Q8➡ | UGC NET November 2020, 24 sept shift 2 In any given year, compared to the previous year which country (s) registered maximum growth (%) ? |
| i ➥ T |
| ii ➥ Z and Y |
| iii ➥ Y |
| iv ➥ X and Z |
Show Answer With Best Explanation
| More Discussion | Explanation On YouTube | Learn Topic Wise | Help-Line |
| Q9➡ | UGC NET November 2020, 24 sept shift 2 Which country registered maximum growth (%) by 2019 with reference to year 2015? |
| i ➥ Z |
| ii ➥ T |
| iii ➥ X |
| iv ➥ Y |
Show Answer With Best Explanation
| More Discussion | Explanation On YouTube | Learn Topic Wise | Help-Line |
| Q10➡ | UGC NET November 2020, 24 sept shift 2 Between 2016 to 2017, which country registered maximum growth (%) in installed capacity of Renewable Energy? |
| i ➥ X |
| ii ➥ Z |
| iii ➥ Y |
| iv ➥ T |
Show Answer With Best Explanation
| More Discussion | Explanation On YouTube | Learn Topic Wise | Help-Line |
| Q11➡ | NET Nov 2020, 25 Sept Shift-I Comprehension: question 11 to question 15 Consider the data in the given table and answer the questions that follow The following table is on the Expenditures of Institution (in lakh Rupees) per annumover the given years. 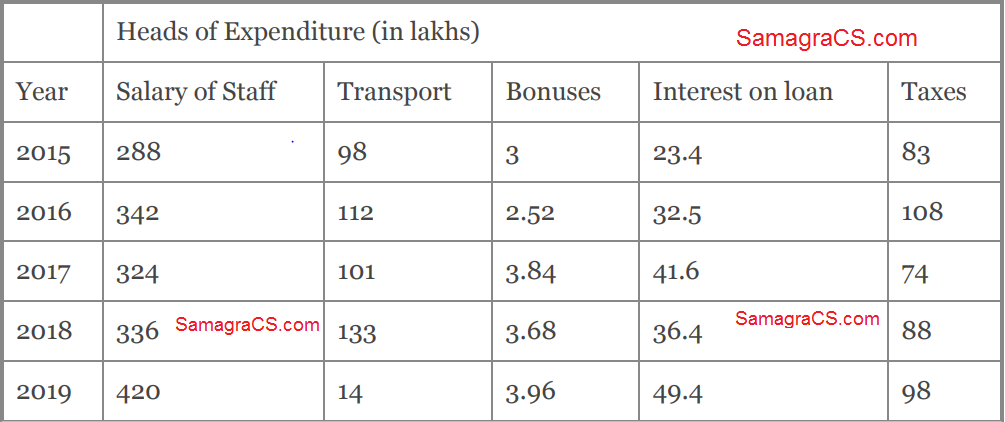 Question-11 What is the average amount of interest per year that the institution had to pay? |
| i ➥ 30.50 |
| ii ➥ 36.66 |
| iii ➥ 39.66 |
| iv ➥ 41.02 |
Show Answer With Best Explanation
| More Discussion | Explanation On YouTube | Learn Topic Wise | Help-Line |
| Q12➡ | NET Nov 2020, 25 Sept Shift-I Comprehension: question 11 to question 15 Consider the data in the given table and answer the questions that follow The following table is on the Expenditures of Institution (in lakh Rupees) per annumover the given years. Question-12 The total amount of bonus paid by the institution during the given period is approximately what percent of the total amount of salary paid during this period? |
| i ➥ ~3 .96 |
| ii ➥ ~4 % |
| iii ➥ ~7 % |
| iv ➥ ~1 % |
Show Answer With Best Explanation
| More Discussion | Explanation On YouTube | Learn Topic Wise | Help-Line |
| Q13➡ | NET Nov 2020, 25 Sept Shift-I Comprehension: question 11 to question 15 Consider the data in the given table and answer the questions that follow The following table is on the Expenditures of Institution (in lakh Rupees) per annumover the given years. Question-13 Total expenditure on all these items in 2015 was approximately what per cent of the total expenditure in 2019? |
| i ➥ 84. 63 % |
| ii ➥ 58 % |
| iii ➥ 91 % |
| iv ➥ 73.96 |
Show Answer With Best Explanation
| More Discussion | Explanation On YouTube | Learn Topic Wise | Help-Line |
| Q14➡ | NET Nov 2020, 25 Sept Shift-I Comprehension: question 11 to question 15 Consider the data in the given table and answer the questions that follow The following table is on the Expenditures of Institution (in lakh Rupees) per annumover the given years. Question-14 The total expenditure of the institution on these items during the year 2017 is |
| i ➥ 624. 6 |
| ii ➥ 524. 44 |
| iii ➥ 544. 44 |
| iv ➥ 591. 41 |
Show Answer With Best Explanation
| More Discussion | Explanation On YouTube | Learn Topic Wise | Help-Line |
| Q15➡ | NET Nov 2020, 25 Sept Shift-I Comprehension: question 11 to question 15 Consider the data in the given table and answer the questions that follow The following table is on the Expenditures of Institution (in lakh Rupees) per annumover the given years. Question-15 The ratio between the expenditure on taxes for the years 2016 and 2018, is approximately |
| i ➥ 17: 11 |
| ii ➥ 27: 22 |
| iii ➥ 31: 27 |
| iv ➥ 19: 17 |
Show Answer With Best Explanation
| More Discussion | Explanation On YouTube | Learn Topic Wise | Help-Line |
| Q16➡ | NET Nov 2020, 25 Sept Shift 2 Comprehension: Question 16 to 20 Study the data table and answer the questions that follow The following table shows the maximum marks of each subject inside the bracket and percentage of marks obtained by seven students in six different subjects in the exam 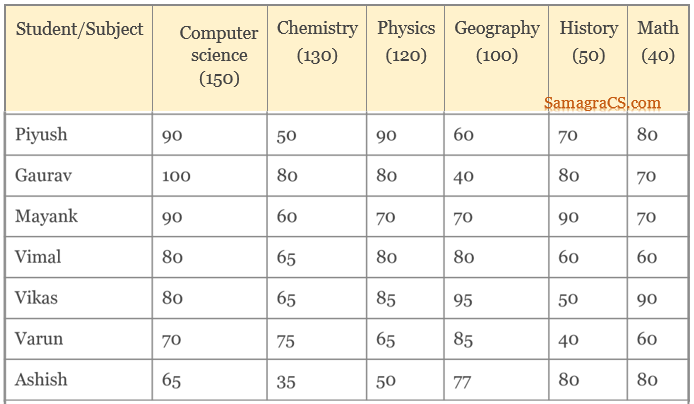 Ques-16 What is the overall percentage of Ashish? |
| i ➥ 54 % |
| ii ➥ 2.68 % |
| iii ➥ 59.66 % |
| iv ➥ 63 % |
Show Answer With Best Explanation
| More Discussion | Explanation On YouTube | Learn Topic Wise | Help-Line |
| Q17➡ | NET Nov 2020, 25 Sept Shift 2 Comprehension: Question 16 to 20 Study the data table and answer the questions that follow The following table shows the maximum marks of each subject inside the bracket and percentage of marks obtained by seven students in six different subjects in the exam Ques-17 The number of students who obtained 60 % and above marks in all subject is: |
| i ➥ 4 |
| ii ➥ |
| iii ➥ 2 |
| iv ➥ 1 |
Show Answer With Best Explan1ation
| More Discussion | Explanation On YouTube | Learn Topic Wise | Help-Line |
| Q18➡ | NET Nov 2020, 25 Sept Shift 2 Comprehension: Question 16 to 20 Study the data table and answer the questions that follow The following table shows the maximum marks of each subject inside the bracket and percentage of marks obtained by seven students in six different subjects in the exam Ques-18 In which subject is the overall percentage the best? |
| i ➥ Computer Science |
| ii ➥ Chemistry |
| iii ➥ Math |
| iv ➥ Physics |
Show Answer With Best Explanation
| More Discussion | Explanation On YouTube | Learn Topic Wise | Help-Line |
| Q19➡ | NET Nov 2020, 25 Sept Shift 2 Comprehension: Question 16 to 20 Study the data table and answer the questions that follow The following table shows the maximum marks of each subject inside the bracket and percentage of marks obtained by seven students in six different subjects in the exam Ques-19 What are the average percentage of marks (%) obtained by all the seven students in Physics? |
| i ➥ ~82.42 |
| ii ➥ ~74.28 |
| iii ➥ ~86.24 |
| iv ➥ ~95.14 |
Show Answer With Best Explanation
| More Discussion | Explanation On YouTube | Learn Topic Wise | Help-Line |
| Q20➡ | NET Nov 2020, 25 Sept Shift 2 Comprehension: Question 16 to 20 Study the data table and answer the questions that follow The following table shows the maximum marks of each subject inside the bracket and percentage of marks obtained by seven students in six different subjects in the exam Ques-20 What are the aggregate of marks obtained by Mayank in all the six subjects? |
| i ➥ 432 |
| ii ➥ 456 |
| iii ➥ 460 |
| iv ➥ 440 |
Show Answer With Best Explanation
| More Discussion | Explanation On YouTube | Learn Topic Wise | Help-Line |
| Q21➡ | NET Nov 2020, 29 Sept Shift 2 Comprehension: Question 21 To 25 Based on the data in the table, answer the questions that follow The following table embodies the details about the students of the different departments A, B and C in a University for participating in the blood donation camp. Participation in Blood Donation Camp – Data ⚹- out of total blood donors 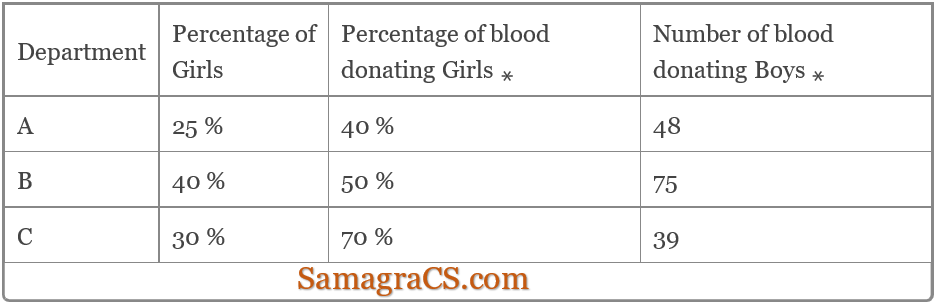 Ques-21 If 45 boys from the department 8 did not donate blood, then the total number of students in the department B is |
| i ➥ 120 |
| ii ➥ 150 |
| iii ➥ 80 |
| iv ➥ 200 |
Show Answer With Best Explanation
| More Discussion | Explanation On YouTube | Learn Topic Wise | Help-Line |
| Q22➡ | NET Nov 2020, 29 Sept Shift 2 Comprehension: Question 21 To 25 Based on the data in the table, answer the questions that follow The following table embodies the details about the students of the different departments A, B and C in a University for participating in the blood donation camp. Participation in Blood Donation Camp – Data ⚹- out of total blood donors Ques-22 The number of students who donated blood in the department ‘C’ is |
| i ➥ 39 |
| ii ➥ 91 |
| iii ➥ 130 |
| iv ➥ 169 |
Show Answer With Best Explanation
| More Discussion | Explanation On YouTube | Learn Topic Wise | Help-Line |
| Q23➡ | NET Nov 2020, 29 Sept Shift 2 Comprehension: Question 21 To 25 Based on the data in the table, answer the questions that follow The following table embodies the details about the students of the different departments A, B and C in a University for participating in the blood donation camp. Participation in Blood Donation Camp – Data ⚹- out of total blood donors Ques-23 The number of girl՚s in the department ‘A’ who donated blood is |
| i ➥ 32 |
| ii ➥ 130 |
| iii ➥ 55 |
| iv ➥ 48 |
Show Answer With Best Explanation
| More Discussion | Explanation On YouTube | Learn Topic Wise | Help-Line |
| Q24➡ | Comprehension: Question 21 To 25 Based on the data in the table, answer the questions that follow The following table embodies the details about the students of the different departments A, B and C in a University for participating in the blood donation camp. Participation in Blood Donation Camp – Data ⚹- out of total blood donors Ques-24 all the girls in the department A donated blood, then the number of boys in the department A ′ who did not participate in the blood donation camp is |
| i ➥ 32 |
| ii ➥ 48 |
| iii ➥ 60 |
| iv ➥ 56 |
Show Answer With Best Explanation
| More Discussion | Explanation On YouTube | Learn Topic Wise | Help-Line |
| Q25➡ | NET Nov 2020, 29 Sept Shift 2 Comprehension: Question 21 To 25 Based on the data in the table, answer the questions that follow The following table embodies the details about the students of the different departments A, B and C in a University for participating in the blood donation camp. Participation in Blood Donation Camp – Data ⚹- out of total blood donors Ques-25 What is the ratio of the number of blood donors in the department A compared to the number of blood donors in ‘B’? |
| i ➥ 1: 5 |
| ii ➥ 2: 5 |
| iii ➥ 9: 16 |
| iv ➥ 8: 15 |
Show Answer With Best Explanation
| More Discussion | Explanation On YouTube | Learn Topic Wise | Help-Line |
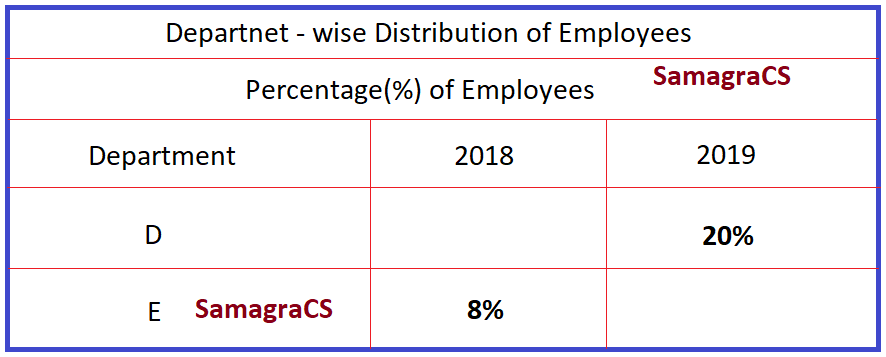
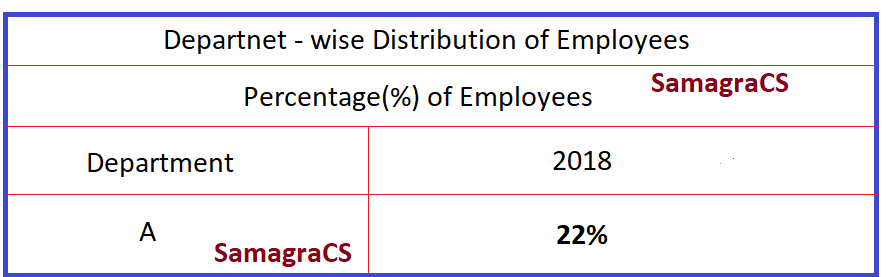
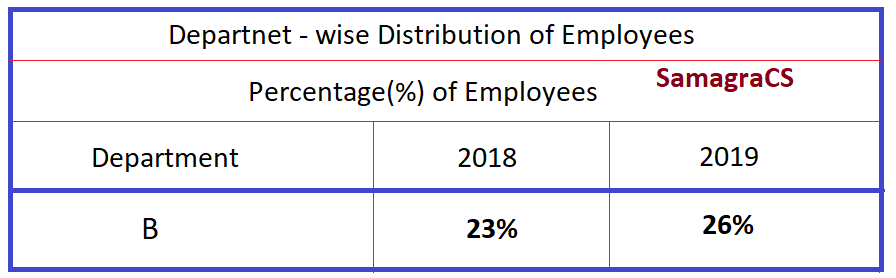
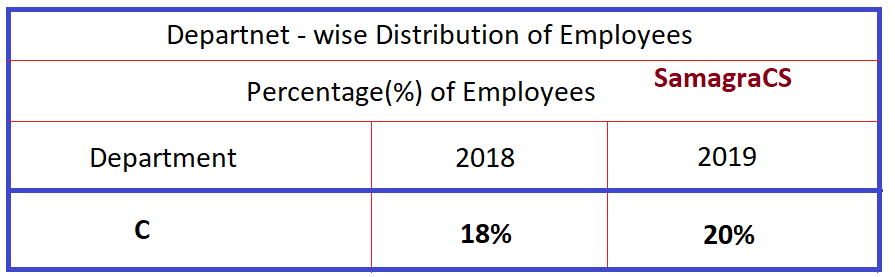
| Q26➡ | NET Nov 2020, 30 Sept Shift 1 Comprehension: Study the data in the table and answer the questions that follow Consider the following table that shows the percentage (%) distribution of employees in five different departments A-E in a company during the years 2018 and 2019. There is a total number of 18000 and 20000 employee՚s in the company during the years 2018 and 2019 respectively. 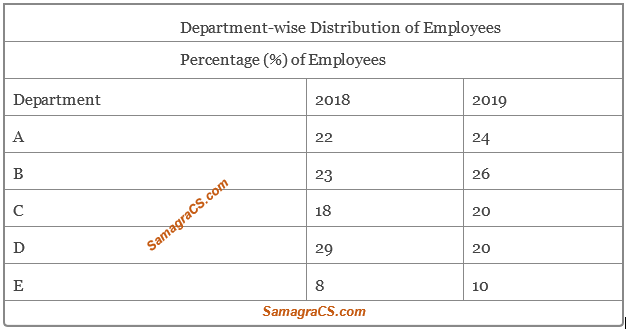 Ques- 26 What is the ratio of the number of employees in the department – E in 2018 compared to those in the department – D in 2019? |
| i ➥ 9: 25 |
| ii ➥ 9: 15 |
| iii ➥ 8: 15 |
| iv ➥ 8: 25 |
Show Answer With Best Explanation
| More Discussion | Explanation On YouTube | Learn Topic Wise | Help-Line |
| Q27➡ | NET Nov 2020, 30 Sept Shift 1 Comprehension: Study the data in the table and answer the questions that follow Consider the following table that shows the percentage (%) distribution of employees in five different departments A-E in a company during the years 2018 and 2019. There is a total number of 18000 and 20000 employee՚s in the company during the years 2018 and 2019 respectively. Ques-27 If the average monthly salary of employees in the Department – A was 24000 in 2018, then what was the approximate total salary expenses of the department – A in 2018? |
| i ➥ ₹ 1.2 crores |
| ii ➥ ₹ 4.7 crores |
| iii ➥ ₹ 1.4 crores |
| iv ➥ ₹ 9.5 crores |
Show Answer With Best Explanation
| More Discussion | Explanation On YouTube | Learn Topic Wise | Help-Line |
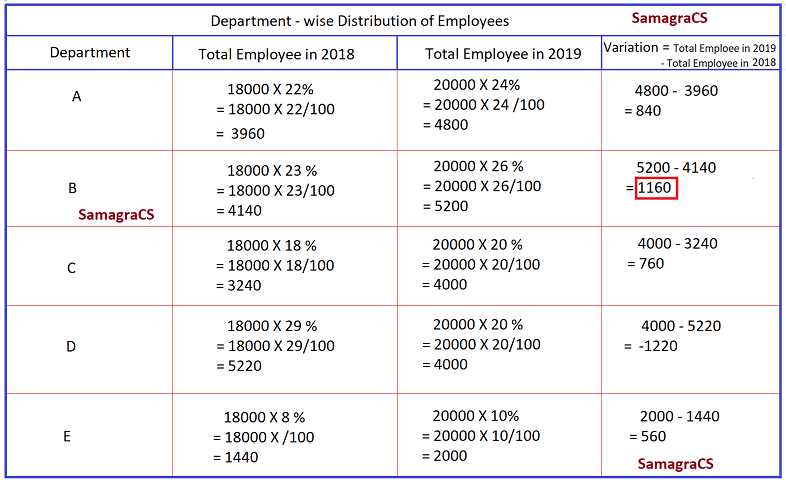
| Q28➡ | NET Nov 2020, 30 Sept Shift 1 Comprehension: Study the data in the table and answer the questions that follow Consider the following table that shows the percentage (%) distribution of employees in five different departments A-E in a company during the years 2018 and 2019. There is a total number of 18000 and 20000 employee՚s in the company during the years 2018 and 2019 respectively. Ques-28 In which department the variation (represented by absolute numbers) in employee strength is maximum in 2019 with reference to 2018? |
| i ➥ Department – A |
| ii ➥ Department – B |
| iii ➥ Department – D |
| iv ➥ Department – E |
Show Answer With Best Explanation
| More Discussion | Explanation On YouTube | Learn Topic Wise | Help-Line |
| Q29➡ | NET Nov 2020, 30 Sept Shift 1 Comprehension: Study the data in the table and answer the questions that follow Consider the following table that shows the percentage (%) distribution of employees in five different departments A-E in a company during the years 2018 and 2019. There is a total number of 18000 and 20000 employee՚s in the company during the years 2018 and 2019 respectively. Ques-29 If 300 employees had left the department – B at the end of 2018, then how many new employees joined in 2019 in the department – B? |
| i ➥ 480 |
| ii ➥ 960 |
| iii ➥ 1360 |
| iv ➥ 1140 |
Show Answer With Best Explanation
| More Discussion | Explanation On YouTube | Learn Topic Wise | Help-Line |
| Q30➡ | NET Nov 2020, 30 Sept Shift 1 Comprehension: Study the data in the table and answer the questions that follow Consider the following table that shows the percentage (%) distribution of employees in five different departments A-E in a company during the years 2018 and 2019. There is a total number of 18000 and 20000 employee՚s in the company during the years 2018 and 2019 respectively. Ques-30 What is the approximate percentage increase in the number of employees in the Department – C in the year 2019 with reference to the year 2018? |
| i ➥ 2 % |
| ii ➥ 2. 34 % |
| iii ➥ 23. 45% |
| iv ➥ 8. 34 % |
Show Answer With Best Explanation
| More Discussion | Explanation On YouTube | Learn Topic Wise | Help-Line |
| Q31➡ | NET Nov 2020, 30 Sept Shift 2 Comprehension: Direction :- Study the data in the given table and answer the questions that follow The table below provides data on the percentage (%) distribution of job vacancies in IT companies situated in various Indian cities in the year 2009 and 2019. In the year 2009, the total number of vacancies was 5.4 lakhs and in the year 2019, it was 8.6 lakhs. 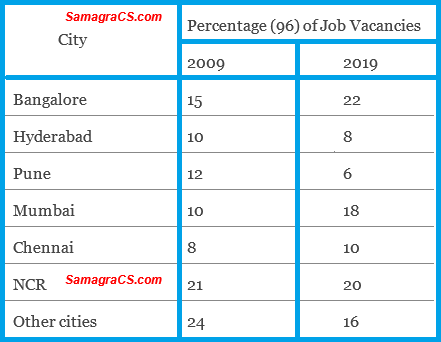 Ques- 31 What is the total number of vacancies available in the city of Chennai in 2009 and in that of Mumbai in the year 2019? |
| i ➥ 2. 16 lakhs |
| ii ➥ 2.04 lakhs |
| iii ➥ 1. 98 lakhs |
| iv ➥ 1. 92 lakhs |
| More Discussion | Explanation On YouTube | Learn Topic Wise | Help-Line |
| Q32➡ | NET Nov 2020, 30 Sept Shift 2 Comprehension: Direction :- Study the data in the given table and answer the questions that follow The table below provides data on the percentage (%) distribution of job vacancies in IT companies situated in various Indian cities in the year 2009 and 2019. In the year 2009, the total number of vacancies was 5.4 lakhs and in the year 2019, it was 8.6 lakhs. Ques- 32 If the number of vacancies in the city of Pune is 48000 in the year 2019 and the percentage distribution is the same as given in the table, then what is the number of vacancies available in NCR in 2019? |
| i ➥ 1. 2 lakhs |
| ii ➥ 1. 32 lakhs |
| iii ➥ 1. 48 lakhs |
| iv ➥ 1. 6 lakhs |
| More Discussion | Explanation On YouTube | Learn Topic Wise | Help-Line |
| Q33➡ | NET Nov 2020, 30 Sept Shift 2 Comprehension: Direction :- Study the data in the given table and answer the questions that follow The table below provides data on the percentage (%) distribution of job vacancies in IT companies situated in various Indian cities in the year 2009 and 2019. In the year 2009, the total number of vacancies was 5.4 lakhs and in the year 2019, it was 8.6 lakhs. Ques- 33 What is the difference between the number of vacancies available in the city of Bangalore in the year 2019 and 2009? |
| i ➥ 108200 |
| ii ➥ 113120 |
| iii ➥ 118400 |
| iv ➥ 96400 |
| More Discussion | Explanation On YouTube | Learn Topic Wise | Help-Line |
| Q34➡ | NET Nov 2020, 30 Sept Shift 2 Comprehension: Direction :- Study the data in the given table and answer the questions that follow The table below provides data on the percentage (%) distribution of job vacancies in IT companies situated in various Indian cities in the year 2009 and 2019. In the year 2009, the total number of vacancies was 5.4 lakhs and in the year 2019, it was 8.6 lakhs. Ques- 34 What is the approximate percentage rise seen in vacancies available in the city of Hyderabad from 2009 to 2019? |
| i ➥ 21. 8 % |
| ii ➥ 23. 23 % |
| iii ➥ 26. 23 % |
| iv ➥ 27. 41 % |
| More Discussion | Explanation On YouTube | Learn Topic Wise | Help-Line |
| Q35➡ | NET Nov 2020, 30 Sept Shift 2 Comprehension: Direction :- Study the data in the given table and answer the questions that follow The table below provides data on the percentage (%) distribution of job vacancies in IT companies situated in various Indian cities in the year 2009 and 2019. In the year 2009, the total number of vacancies was 5.4 lakhs and in the year 2019, it was 8.6 lakhs. Ques- 35 What is the average number of vacancies available in the city of Hyderabad in the year 2009 and 2019? |
| i ➥ 41080 |
| ii ➥ 42740 |
| iii ➥ 58610 |
| iv ➥ 61400 |
| More Discussion | Explanation On YouTube | Learn Topic Wise | Help-Line |
| Q36➡ | UGC NET November 2020, 1 oct shift 1 Comprehension: Directions : Study the data in the given table and answer the questions that follow The table below embodies data on the number of students who appeared (A) and passed (P) in a competitive examination from four different zones (K, L, M and N) during the year 2014 to 2019. 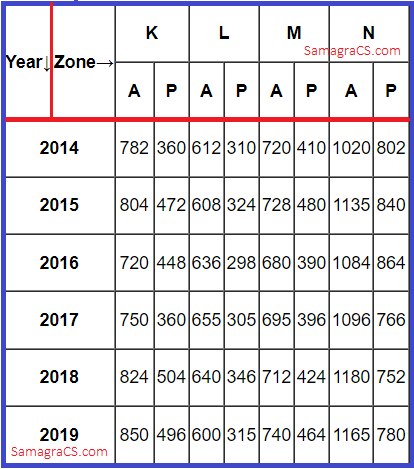 * The total number of students who passed from Zone-M in all the six years taken together is approximately what percentage of the total number of students who appeared from Zone-M in all the six years taken together? |
| i ➥ 56 % |
| ii ➥ 58 % |
| iii ➥ 60 % |
| iv ➥ 64 % |
Show Answer With Best Explanation
| More Discussion | Explanation On YouTube | Learn Topic Wise | Help-Line |
| Q37➡ | UGC NET November 2020, 1 oct shift 1 Comprehension: Directions : Study the data in the given table and answer the questions that follow The table below embodies data on the number of students who appeared (A) and passed (P) in a competitive examination from four different zones (K, L, M and N) during the year 2014 to 2019. * What is the ratio of the number of students who passed from Zone-K in the year 2017 compared to that in 2018? |
| i ➥ 7: 5 |
| ii ➥ 3: 5 |
| iii ➥ 5: 7 |
| iv ➥ 5: 3 |
Show Answer With Best Explanation
| More Discussion | Explanation On YouTube | Learn Topic Wise | Help-Line |
| Q38➡ | UGC NET November 2020, 1 oct shift 1 Comprehension: Directions : Study the data in the given table and answer the questions that follow The table below embodies data on the number of students who appeared (A) and passed (P) in a competitive examination from four different zones (K, L, M and N) during the year 2014 to 2019. *For which of the following Zones, the percentage of students who passed out to the total of those who appeared in the examination is minimum in the year 2019? |
| i ➥ K |
| ii ➥ L |
| iii ➥ M |
| iv ➥ N |
Show Answer With Best Explanation
| More Discussion | Explanation On YouTube | Learn Topic Wise | Help-Line |
| Q39➡ | UGC NET November 2020, 1 oct shift 1 Comprehension: Directions : Study the data in the given table and answer the questions that follow The table below embodies data on the number of students who appeared (A) and passed (P) in a competitive examination from four different zones (K, L, M and N) during the year 2014 to 2019. * What is the average number of students who passed in the exam from all the four Zones in the year 2015? |
| i ➥ 528 |
| ii ➥ 529 |
| iii ➥ 530 |
| iv ➥ 531 |
Show Answer With Best Explanation
| More Discussion | Explanation On YouTube | Learn Topic Wise | Help-Line |
| Q40➡ | UGC NET November 2020, 1 oct shift 1 Comprehension: Directions : Study the data in the given table and answer the questions that follow The table below embodies data on the number of students who appeared (A) and passed (P) in a competitive examination from four different zones (K, L, M and N) during the year 2014 to 2019. * What is the difference between the total number of students who appeared in the exam and the total number of students who passed in the exam from Zone-K in all the six years taken together? |
| i ➥ 2060 |
| ii ➥ 2070 |
| iii ➥ 2080 |
| iv ➥ 2090 |
Show Answer With Best Explanation
| More Discussion | Explanation On YouTube | Learn Topic Wise | Help-Line |
| Q41➡ | UGC NET November 2020, 9 oct shift 1 Comprehension: Directions: The table below provides data on the number of candidates who appeared (A) and qualified (Q) in a test during the years from 2014 to 2019 from five different zones J, K,L, M and N. In accordance with the table, answer the questions 1 – 5 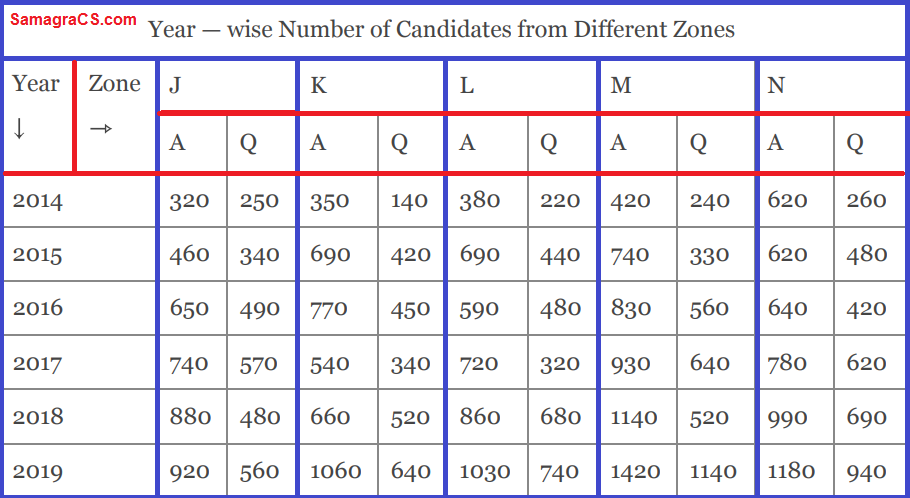 * The number of candidates who appeared in the test from Zone — K in the year 2017 was approximately what percentage of the number of candidates who qualified the test from the Zone — L in the year 2019: |
| i ➥ 88 % |
| ii ➥ 83 % |
| iii ➥ 73 % |
| iv ➥ 68 % |
Show Answer With Best Explanation
| More Discussion | Explanation On YouTube | Learn Topic Wise | Help-Line |
| Q42➡ | UGC NET November 2020, 9 oct shift 1 Comprehension: Directions: The table below provides data on the number of candidates who appeared (A) and qualified (Q) in a test during the years from 2014 to 2019 from five different zones J, K,L, M and N. In accordance with the table, answer the questions 1 – 5 * The difference between the number of candidates who appeared and qualified in the test from Zone-M in the given period was the second lowest in the year: |
| i ➥ 2014 |
| ii ➥ 2016 |
| iii ➥ 2017 |
| iv ➥ 2019 |
Show Answer With Best Explanation
| More Discussion | Explanation On YouTube | Learn Topic Wise | Help-Line |
| Q43➡ | UGC NET November 2020, 9 oct shift 1 Comprehension: Directions: The table below provides data on the number of candidates who appeared (A) and qualified (Q) in a test during the years from 2014 to 2019 from five different zones J, K,L, M and N. In accordance with the table, answer the questions 1 – 5 * The total number of candidates who qualified the test in the year 2018 and 2019 together was the second highest in the zone: |
| i ➥ J |
| ii ➥ N |
| iii ➥ K |
| iv ➥ L |
Show Answer With Best Explanation
| More Discussion | Explanation On YouTube | Learn Topic Wise | Help-Line |
| Q44➡ | UGC NET November 2020, 9 oct shift 1 Comprehension: Directions: The table below provides data on the number of candidates who appeared (A) and qualified (Q) in a test during the years from 2014 to 2019 from five different zones J, K,L, M and N. In accordance with the table, answer the questions 1 – 5 * The ratio of the number of candidates who appeared in the test from the Zone — J in the year 2014 to the number of candidates who qualified the test from the Zone — M in the year 2016 was: |
| i ➥ 4: 7 |
| ii ➥ 4: 9 |
| iii ➥ 9: 4 |
| iv ➥ 8: 13 |
Show Answer With Best Explanation
| More Discussion | Explanation On YouTube | Learn Topic Wise | Help-Line |
| Q45➡ | UGC NET November 2020, 9 oct shift 1 Comprehension: Directions: The table below provides data on the number of candidates who appeared (A) and qualified (Q) in a test during the years from 2014 to 2019 from five different zones J, K,L, M and N. In accordance with the table, answer the questions 1 – 5 * What was the average number of candidates who appeared in the test from Zone — N over all the years together? |
| i ➥ 810 |
| ii ➥ 815 |
| iii ➥ 825 |
| iv ➥ 805 |
Show Answer With Best Explanation
| More Discussion | Explanation On YouTube | Learn Topic Wise | Help-Line |
| Q46➡ | UGC NET November 2020, 9 oct shift 2 Comprehension: Directions: The table below embodies data on the oil import (in million tonnes) from six different countries over the years 2015 to 2019. In accordance with the table, answer the Questions 1 – 5. 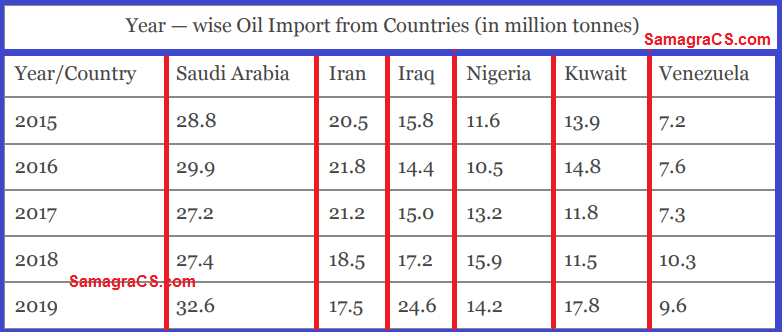 *What is the approximate percentage of oil import from Iran in the year 2017 with respect to the total oil import from Iran in all the years together? |
| i ➥ 20 % |
| ii ➥ 23 % |
| iii ➥ 21 % |
| iv ➥ 2 % |
Show Answer With Best Explanation
| More Discussion | Explanation On YouTube | Learn Topic Wise | Help-Line |
| Q47➡ | UGC NET November 2020, 9 oct shift 2 Comprehension: Directions: The table below embodies data on the oil import (in million tonnes) from six different countries over the years 2015 to 2019. In accordance with the table, answer the Questions 1 – 5. *What is the ratio of average of oil imports from Iraq to that from Venezuela for all the years together? |
| i ➥ 14: 29 |
| ii ➥ 29: 14 |
| iii ➥ 39: 23 |
| iv ➥ 23: 39 |
Show Answer With Best Explanation
| More Discussion | Explanation On YouTube | Learn Topic Wise | Help-Line |
| Q48➡ | UGC NET November 2020, 9 oct shift 2 Comprehension: Directions: The table below embodies data on the oil import (in million tonnes) from six different countries over the years 2015 to 2019. In accordance with the table, answer the Questions 1 – 5. *If P and Q are the average oil import from all the countries in the year 2019 and 2017 respectively, then P-Q is approximately equal to: |
| i ➥ 3.43 million tonnes |
| ii ➥ 3.34 million tonnes |
| iii ➥ 2.43 million tonnes |
| iv ➥ 2.34 million tonnes |
Show Answer With Best Explanation
| More Discussion | Explanation On YouTube | Learn Topic Wise | Help-Line |
| Q49➡ | UGC NET November 2020, 9 oct shift 2 Comprehension: Directions: The table below embodies data on the oil import (in million tonnes) from six different countries over the years 2015 to 2019. In accordance with the table, answer the Questions 1 – 5. *In which of the following years the percentage increase/decrease in oil import from Nigeria over its previous year is the maximum? |
| i ➥ 2016 |
| ii ➥ 2018 |
| iii ➥ 2017 |
| iv ➥ 2019 |
Show Answer With Best Explanation
| More Discussion | Explanation On YouTube | Learn Topic Wise | Help-Line |
| Q50➡ | UGC NET November 2020, 9 oct shift 2 Comprehension: Directions: The table below embodies data on the oil import (in million tonnes) from six different countries over the years 2015 to 2019. In accordance with the table, answer the Questions 1 – 5. *What is the approximate average of percentage increase or decrease in oil import from Kuwait over its previous year for the given period? |
| i ➥ 4 % |
| ii ➥ 5 % |
| iii ➥ 15 % |
| iv ➥ 21 % |
Show Answer With Best Explanation
| More Discussion | Explanation On YouTube | Learn Topic Wise | Help-Line |
| Q51➡ | UGC NET November 2020, 17 oct shift 1 Comprehension: The table below embodies data on the number of candidates who appeared for an interview (I) and got admission (II) in five engineering disciplines during the year 2014 to 2019. In accordance with the table, answer the questions 51 – 55: 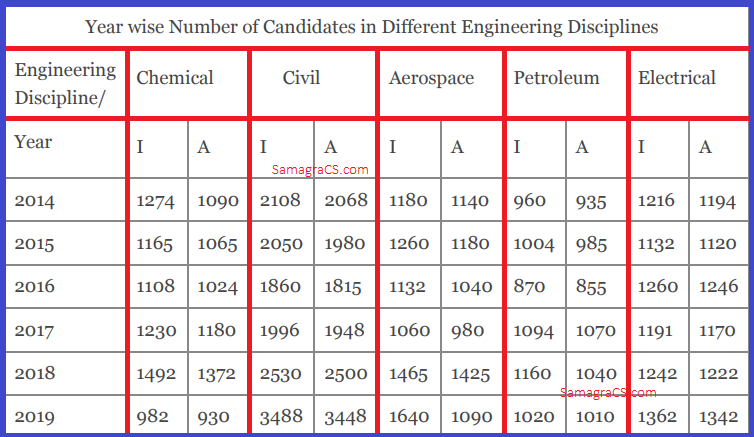 * What is the percentage increase/decrease in the number of candidates admitted in Civil Engineering discipline from the year 2015 to 2016? |
| i ➥ 9.09 % |
| ii ➥ 8.43 % |
| iii ➥ 8.33 % |
| iv ➥ 9.19 % |
Show Answer With Best Explanation
| More Discussion | Explanation On YouTube | Learn Topic Wise | Help-Line |
| Q52➡ | UGC NET November 2020, 17 oct shift 1 Comprehension: The table below embodies data on the number of candidates who appeared for an interview (I) and got admission (II) in five engineering disciplines during the year 2014 to 2019. In accordance with the table, answer the questions 51 – 55: *What is the percentage of the total number of candidates admitted to the total number of candidates interviewed for all the years in Chemical Engineering discipline? |
| i ➥ 8.1 % |
| ii ➥ 91.68 % |
| iii ➥ 8.8 % |
| iv ➥ 91.86 % |
Show Answer With Best Explanation
| More Discussion | Explanation On YouTube | Learn Topic Wise | Help-Line |
| Q53➡ | UGC NET November 2020, 17 oct shift 1 Comprehension: The table below embodies data on the number of candidates who appeared for an interview (I) and got admission (II) in five engineering disciplines during the year 2014 to 2019. In accordance with the table, answer the questions 51 – 55: * What is the average number of candidates who appeared for an interview in the year 2016 for admission to all the five engineering disciplines? |
| i ➥ 1216 |
| ii ➥ 1314 |
| iii ➥ 1316 |
| iv ➥ 1246 |
Show Answer With Best Explanation
| More Discussion | Explanation On YouTube | Learn Topic Wise | Help-Line |
| Q54➡ | UGC NET November 2020, 17 oct shift 1 Comprehension: The table below embodies data on the number of candidates who appeared for an interview (I) and got admission (II) in five engineering disciplines during the year 2014 to 2019. In accordance with the table, answer the questions 51 – 55: * The ratio of number of candidates who appeared in an interview for admission to Petroleum Engineering discipline in the year 2014 compared to the number of candidates who got admission in Electrical Engineering discipline in the year 2015 is: |
| i ➥ 3: 5 |
| ii ➥ 6: 7 |
| iii ➥ 7: 6 |
| iv ➥ 5: 3 |
Show Answer With Best Explanation
| More Discussion | Explanation On YouTube | Learn Topic Wise | Help-Line |
| Q55➡ | UGC NET November 2020, 17 oct shift 1 Comprehension: The table below embodies data on the number of candidates who appeared for an interview (I) and got admission (II) in five engineering disciplines during the year 2014 to 2019. In accordance with the table, answer the questions 51 – 55: * What is the difference between the total number of candidates who appeared for an interview over the six years in Aerospace and Electrical Engineering disciplines? |
| i ➥ 334 |
| ii ➥ 61 |
| iii ➥ 66 |
| iv ➥ 344 |
Show Answer With Best Explanation
| More Discussion | Explanation On YouTube | Learn Topic Wise | Help-Line |
| Q56➡ | UGC NET November 2020, 17 oct shift 2 Comprehension: Consider the following table that shows the percentage (%) distribution of runs scored by an Indian batsman against different countries in one-day internationals (ODI) and T20 world cup matches. Total runs scored by the Indian batsman in ODI and T20 are 2800 and 2000 respectively. Note:- Based on the data in the table, answer the questions 1 – 5: 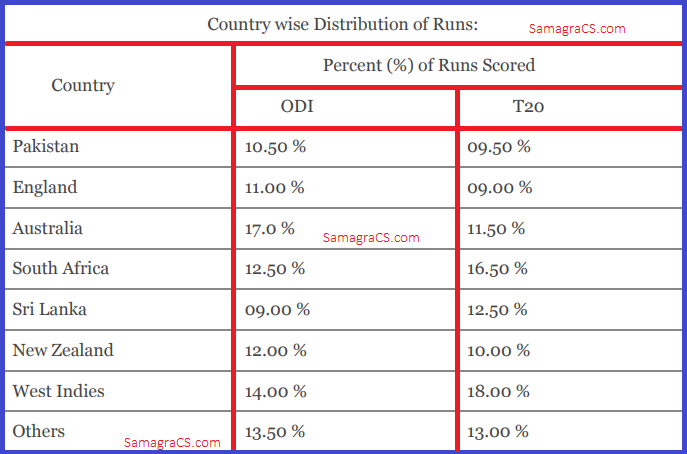 *Total runs scored by the batsman against New Zealand in T20 matches are approximately what percent (%) of the total runs scored against Pakistan in ODI matches? |
| i ➥ 64 % |
| ii ➥ 66 % |
| iii ➥ 62 % |
| iv ➥ 68 % |
Show Answer With Best Explanation
| More Discussion | Explanation On YouTube | Learn Topic Wise | Help-Line |
| Q57➡ | UGC NET November 2020, 17 oct shift 2 Comprehension: Consider the following table that shows the percentage (%) distribution of runs scored by an Indian batsman against different countries in one-day internationals (ODI) and T20 world cup matches. Total runs scored by the Indian batsman in ODI and T20 are 2800 and 2000 respectively. Note:- Based on the data in the table, answer the questions 1 – 5: * In the case of which of the following countries, the difference between the runs scored by the batsman in ODI and T20 is the second lowest? |
| i ➥ Sri Lanka |
| ii ➥ Pakistan |
| iii ➥ South Africa |
| iv ➥ West Indies |
Show Answer With Best Explanation
| More Discussion | Explanation On YouTube | Learn Topic Wise | Help-Line |
| Q58➡ | UGC NET November 2020, 17 oct shift 2 Comprehension: Consider the following table that shows the percentage (%) distribution of runs scored by an Indian batsman against different countries in one-day internationals (ODI) and T20 world cup matches. Total runs scored by the Indian batsman in ODI and T20 are 2800 and 2000 respectively. Note:- Based on the data in the table, answer the questions 1 – 5: * If the batsman played 14 innings against Sri Lanka in ODI and remained not out in 5 innings, then the average runs scored by the batsman against Sri Lanka are: |
| i ➥ 28 |
| ii ➥ 24 |
| iii ➥ 26 |
| iv ➥ 22 |
Show Answer With Best Explanation
| More Discussion | Explanation On YouTube | Learn Topic Wise | Help-Line |
| Q59➡ | UGC NET November 2020, 17 oct shift 2 Comprehension: Consider the following table that shows the percentage (%) distribution of runs scored by an Indian batsman against different countries in one-day internationals (ODI) and T20 world cup matches. Total runs scored by the Indian batsman in ODI and T20 are 2800 and 2000 respectively. Note:- Based on the data in the table, answer the questions 1 – 5: * The runs scored by the batsman against West Indies in T20 are approximately what percent (%) of the runs scored against Australia in ODI? |
| i ➥ 71 % |
| ii ➥ 75 % |
| iii ➥ 73 % |
| iv ➥ 69 % |
Show Answer With Best Explanation
| More Discussion | Explanation On YouTube | Learn Topic Wise | Help-Line |
| Q60➡ | UGC NET November 2020, 17 oct shift 2 Comprehension: Consider the following table that shows the percentage (%) distribution of runs scored by an Indian batsman against different countries in one-day internationals (ODI) and T20 world cup matches. Total runs scored by the Indian batsman in ODI and T20 are 2800 and 2000 respectively. Note:- Based on the data in the table, answer the questions 1 – 5: * If the batsman had scored 280 runs against Pakistan in T20 matches, then what would have been the percentage of runs scored by the batsman in the T20 matches against all other countries (Assuming that the total runs scored by the batsman in T20 remains the same (that is 2000) ? |
| i ➥ 88 % |
| ii ➥ 84 % |
| iii ➥ 86 % |
| iv ➥ 90 % |
Show Answer With Best Explanation
| More Discussion | Explanation On YouTube | Learn Topic Wise | Help-Line |
Q61➡ | UGC NET November 2020, 5 nov shift 2 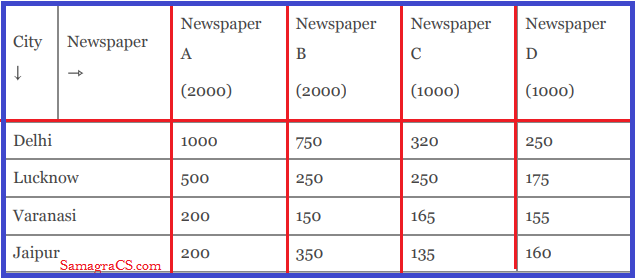 *In which city the distribution of paper is minimum? |
| i ➥ Jaipur |
| ii ➥ Lucknow |
| iii ➥ Delhi |
| iv ➥ Varanasi |
Show Answer With Best Explanation
| More Discussion | Explanation On YouTube | Learn Topic Wise | Help-Line |
| Q62➡ | UGC NET November 2020, 5 nov shift 2 * What is the percentage of distributed newspapers compared to printed newspapers? |
| i ➥ 83.5 % |
| ii ➥ 84.0 % |
| iii ➥ 82.0 % |
| iv ➥ 82.5 % |
Show Answer With Best Explanation
| More Discussion | Explanation On YouTube | Learn Topic Wise | Help-Line |
| Q63➡ | UGC NET November 2020, 5 nov shift 2 * What is the percentage of distribution of newspaper C in all the cities as compared to total number of newspapers distributed? |
| i ➥ 16.46 % |
| ii ➥ 17.36 % |
| iii ➥ 18.42 % |
| iv ➥ 16.36 % |
Show Answer With Best Explanation
| More Discussion | Explanation On YouTube | Learn Topic Wise | Help-Line |
| Q64 ➡ | UGC NET November 2020, 5 nov shift 2 * What is the ratio of distribution of Newspaper A to newspaper B? |
| i ➥ 16: 15 |
| ii ➥ 7: 5 |
| iii ➥ 19: 15 |
| iv ➥ 17: 15 |
Show Answer With Best Explanation
| More Discussion | Explanation On YouTube | Learn Topic Wise | Help-Line |
| Q65➡ | UGC NET November 2020, 5 nov shift 2 * What is the ratio of total distributed paper to total newspaper printed? |
| i ➥ 5: 6 |
| ii ➥ 51: 60 |
| iii ➥ 167: 200 |
| iv ➥ 52: 61 |
Show Answer With Best Explanation
| More Discussion | Explanation On YouTube | Learn Topic Wise | Help-Line |
| Q66➡ | UGC NET November 2020, 11 nov shift 1 Comprehension: The Following table shows total number of students in the Department of the Institute along with percentage of Females and Male students. Answer questions 66 to 70 based on the data given below: 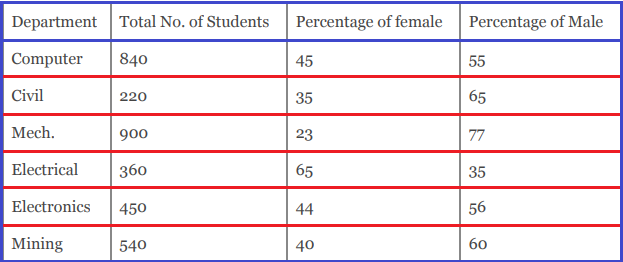 What is the average percentage of female students in the whole Institute? |
| i ➥ 42.0 % |
| ii ➥ 41.0 % |
| iii ➥ 43.0 % |
| iv ➥ 41.5 % |
Show Answer With Best Explanation
| More Discussion | Explanation On YouTube | Learn Topic Wise | Help-Line |
| Q67➡ | UGC NET November 2020, 11 nov shift 1 Comprehension: The Following table shows total number of students in the Department of the Institute along with percentage of Females and Male students. Answer questions 66 to 70 based on the data given below: *What is the ratio of the number of females in Civil and Electrical departments together to the number of males in the same Departments together? |
| i ➥ 311: 270 |
| ii ➥ 329: 261 |
| iii ➥ 411: 469 |
| iv ➥ 311: 269 |
Show Answer With Best Explanation
| More Discussion | Explanation On YouTube | Learn Topic Wise | Help-Line |
| Q68➡ | UGC NET November 2020, 11 nov shift 1 Comprehension: The Following table shows total number of students in the Department of the Institute along with percentage of Females and Male students. Answer questions 66 to 70 based on the data given below: *What is the total number of male students in Computer and Mining Department together? |
| i ➥ 266 |
| ii ➥ 886 |
| iii ➥ 786 |
| iv ➥ 686 |
Show Answer With Best Explanation
| More Discussion | Explanation On YouTube | Learn Topic Wise | Help-Line |
| Q69➡ | UGC NET November 2020, 11 nov shift 1 Comprehension: The Following table shows total number of students in the Department of the Institute along with percentage of Females and Male students. Answer questions 66 to 70 based on the data given below: * What is the total number of students in all the Departments? |
| i ➥ 2210 |
| ii ➥ 3210 |
| iii ➥ 3400 |
| iv ➥ 3310 |
Show Answer With Best Explanation
| More Discussion | Explanation On YouTube | Learn Topic Wise | Help-Line |
| Q70➡ | UGC NET November 2020, 11 nov shift 1 Comprehension: The Following table shows total number of students in the Department of the Institute along with percentage of Females and Male students. Answer questions 66 to 70 based on the data given below: *What is the respective ratio of the number of females in Mechanical Department to the number of females in Electronics Department? |
| i ➥ 4: 3 |
| ii ➥ 23: 22 |
| iii ➥ 24: 21 |
| iv ➥ 23: 21 |
Show Answer With Best Explanation
| More Discussion | Explanation On YouTube | Learn Topic Wise | Help-Line |
| Q71➡ | UGC NET November 2020, 11 nov shift 2 Comprehension: The following table shows number of pages printed by five printers A to E during Monday to Friday. Study the table and answer the following questions 71 – 75: 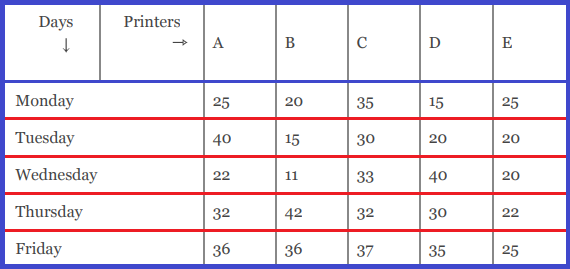 *Total number of pages printed by all printers in five days is |
| i ➥ 678 |
| ii ➥ 686 |
| iii ➥ 698 |
| iv ➥ 708 |
Show Answer With Best Explanation
| More Discussion | Explanation On YouTube | Learn Topic Wise | Help-Line |
| Q72➡ | UGC NET November 2020, 11 nov shift 2 Comprehension: The following table shows number of pages printed by five printers A to E during Monday to Friday. Study the table and answer the following questions 71 – 75: *What is the average number of pages printed by printer C on Monday, Wednesday, Thursday and Friday taken together? |
| i ➥ 33 |
| ii ➥ 33.25 |
| iii ➥ 34 |
| iv ➥ 34.25 |
Show Answer With Best Explanation
| More Discussion | Explanation On YouTube | Learn Topic Wise | Help-Line |
| Q73➡ | UGC NET November 2020, 11 nov shift 2 Comprehension: The following table shows number of pages printed by five printers A to E during Monday to Friday. Study the table and answer the following questions 71 – 75: *What is the ratio between pages printed by printer E on Monday and pages printed by printer D on Wednesday? |
| i ➥ 5: 6 |
| ii ➥ 6: 5 |
| iii ➥ 15: 6 |
| iv ➥ 5: 8 |
Show Answer With Best Explanation
| More Discussion | Explanation On YouTube | Learn Topic Wise | Help-Line |
| Q74➡ | UGC NET November 2020, 11 nov shift 2 Comprehension: The following table shows number of pages printed by five printers A to E during Monday to Friday. Study the table and answer the following questions 71 – 75: *In all five days of printing, what percentage of pages printed by printer D has been printed by printer E? |
| i ➥ 75 % |
| ii ➥ 80 % |
| iii ➥ 82 % |
| iv ➥ 85 % |
Show Answer With Best Explanation
| More Discussion | Explanation On YouTube | Learn Topic Wise | Help-Line |
| Q75➡ | UGC NET November 2020, 11 nov shift 2 Comprehension: The following table shows number of pages printed by five printers A to E during Monday to Friday. Study the table and answer the following questions 71 – 75: *Which printer has printed third lowest number of pages in all the five days taken together? |
| i ➥ B |
| ii ➥ C |
| iii ➥ D |
| iv ➥ E |
Show Answer With Best Explanation
| More Discussion | Explanation On YouTube | Learn Topic Wise | Help-Line |