Hypothesis Testing
Hypothesis Testing
In this tutorial, we will discuss Hypothesis Testing. Before Hypothesis Testing, Let’s first see what is research hypothesis:
Key Points:
1. What is Hypothesis or Research Hypothesis?
2. Parameters and Statistics?
3. Hypothesis Testing?
3. Hypothesis Examples?
Hypothesis Testing What is Hypothesis or Research Hypothesis
1.What is Hypothesis or Research Hypothesis:
| ✰ The hypothesis is tentative assumption, guess or prediction about the outcome. |
| ✰ A hypothesis is tested by collecting information that will enable us to conclude if our prediction was right. |
Hypothesis Testings
2. Parameters and Statistics
| ✰ Parameter: Characteristic of the population is called parameter. ✰ Statistics: Characteristic of the sample is called statistics. |
| ✰ In statistical hypothesis, a parameter is a description of a population, while a statistics is a description of a sample. |
| ✰ For example, if you ask every student in your class (population) about their marks, you get a parameter, because it is a true description about the population since every students was asked. Now, if you want to guess the average marks of students in your class (population) using the marks of few student (or sample), then you get statistics. |
Hypothesis Testings
3.Hypothesis Testing:
| ✰ In statistical analysis, we generally talk about null hypothesis and alternative hypothesis. Hypothesis testing is a form of statistical analysis, where two statements (Null and Alternate Hypothesis) about a population are evaluated to conclude which statement is best supported by sample data. |
Basic concepts in the context of testing hypotheses need to be explained:
A. Null Hypothesis and Alternate Hypothesis.
B. Sampling Errors.
C. The level of significance.
D. Two-tailed and One-tailed tests.
E. Normal Distribution
A. Null Hypothesis and Alternate Hypothesis:
- Null Hypothesis (H0):
- A Null Hypothesis is an assumption statement, states that there is ‘no difference’, ‘no change’, ‘no relationship’ and ‘no effect’ between the two variables being studied (one variable does not affect the other).
- Alternate Hypothesis(Ha or H1):
- It is the opposite of null hypothesis.
- The alternative hypothesis is an assumption states that there is a relationship between the two variables being studied (one variable has an effect on the other).
| ✰ In Hypothesis testing, we test the Null Hypothesis using the outcome of sample. If our outcome supports Null hypothesis, then Null Hypothesis is accepted and automatically alternate hypothesis is rejected. If our outcome does not support null hypothesis, then Null hypothesis is rejected and automatically alternate hypothesis is accepted. |
Note: In Hypothesis Testing, only null hypothesis is tested. Alternate hypothesis is not tested.
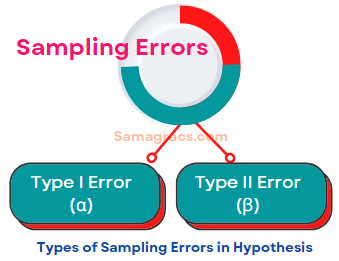
B. Sampling Errors:
In the context of testing of hypotheses, there are basically two types of errors:
1) Type I Error
2) Type II Error
1) Type I Error
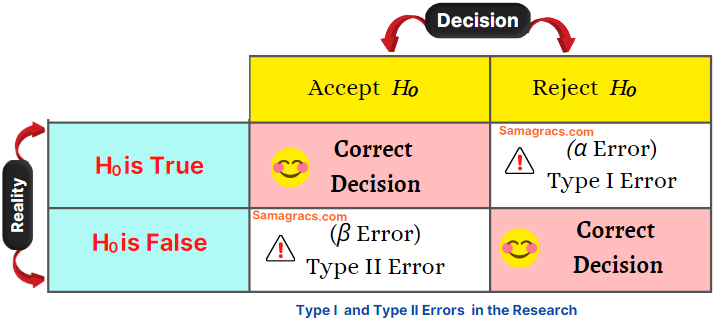
| ✰ Type I error means rejection of the Null hypothesis (H0) when H0 is actually true. Type II error is also known as Alpha (α) error. The Probability of Type I error is called the level of significance of the test. |
Hypothesis Testings
2) Type II Error
| ✰ Type II error means acceptance of the Null hypothesis (H0) when H0 is actually false. Type II error is also known as beta (β) error. |
Type I and Type II Errors in the Research
Type I and Type II Errors in the Research
Examples of Type I and Type II Errors in the Research
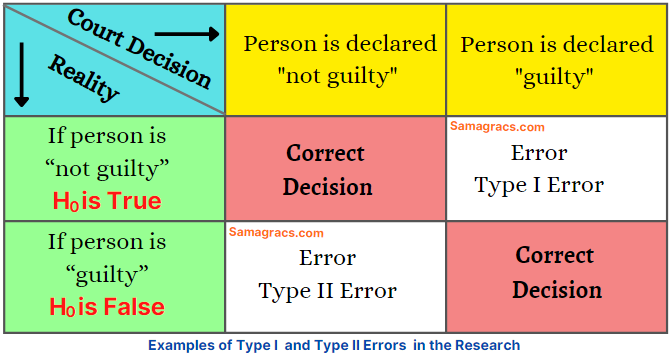
Note: Type I errors are in general considered more serious than Type II errors.
C. The level of significance:
| ✰ This is a very important concept in the context of hypothesis testing. It may be set as 1%, 5%, or 10%. If we take the 5% significance level, it means that the researcher is willing to take as much as a 5% risk of rejecting the null hypothesis when it (H0) happens to be true. |
| ✰ If type I error or level of significance is fixed at 5%, it means that there are about 5 chances in 100 that we will reject H0 when H0 is true. |
Type of Hypothesis Test in Research
Hypothesis Testings
D. Two-tailed and One-tailed tests:
Type of Hypothesis Test in Research
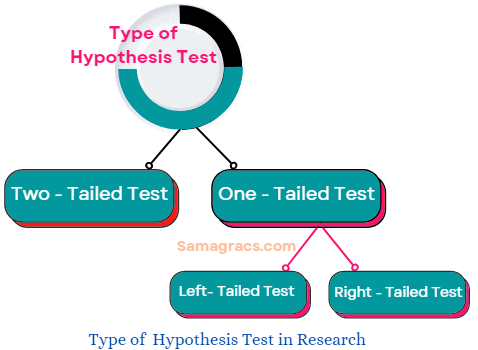
Two-tailed test Vs One-tailed test
Two-tailed test
Two-tailed test
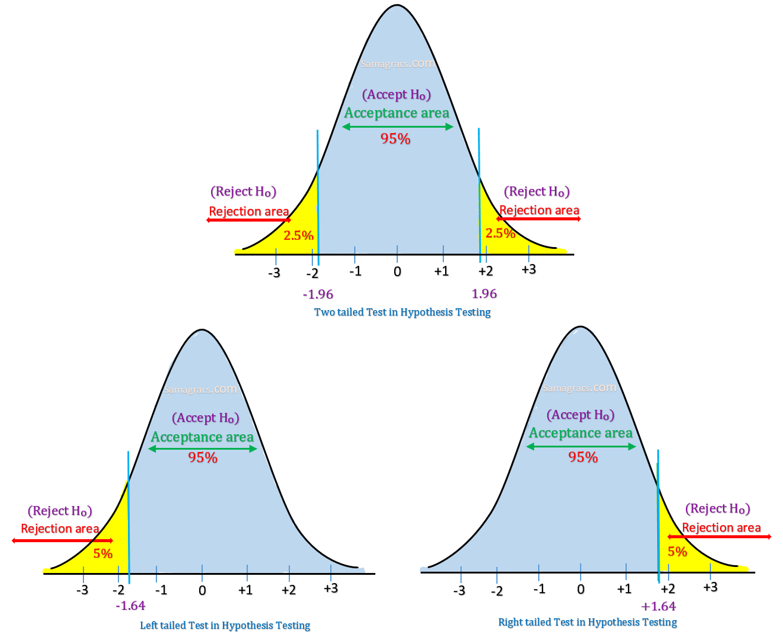
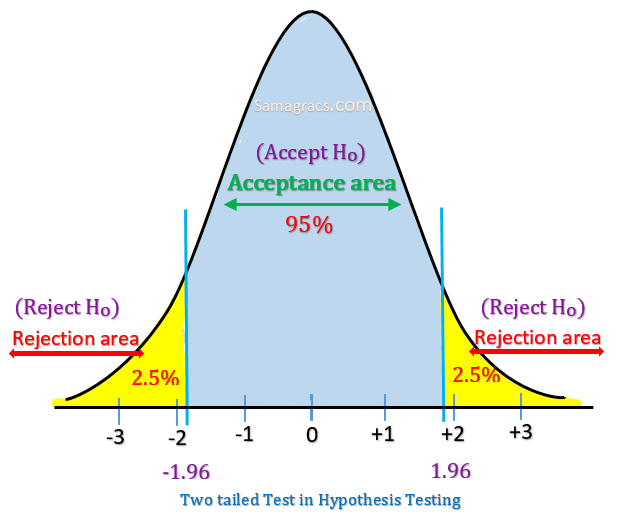
| ✰ A two-tailed test rejects the null hypothesis (H0) when the sample means is significantly not equal (either greater than or less than) to the hypothesised value of the population mean. ✰ Or in simple words, when Alternate Hypothesis talk about ‘not equal to’, then two tailed test is used. ✰ One-tailed tests are non-directional as there is only one rejection region. Example: H0: = (Girls are equal to boys in performance). Ha: ≠ (Girls are not equal to boys in performance. ✰ In this case, Null Hypothesis is rejected when either Girls are better than boys (>) or Girls are less than (>) boys in performance. ✰ If the significance level (or α) is 5%, then probability of the rejection area will be 0.05 (equally divided on both tails of the curve as 0.025) and acceptance region will be 0.95. ✰ In a two-tailed test, there are two rejection regions, one on each tail of the curve which can be illustrated as under: ✰ Mathematically we can state: Acceptance Region A: |Z| <= 1.96 Rejection Region R: |Z| > 1.96 |
One-tailed test
One-tailed test
| ✰ A one-tailed test is used when the population means is either lower than or higher than some hypothesised value of sample mean. ✰ One-tailed tests are directional as there is only one rejection region. |
Left-tailed test
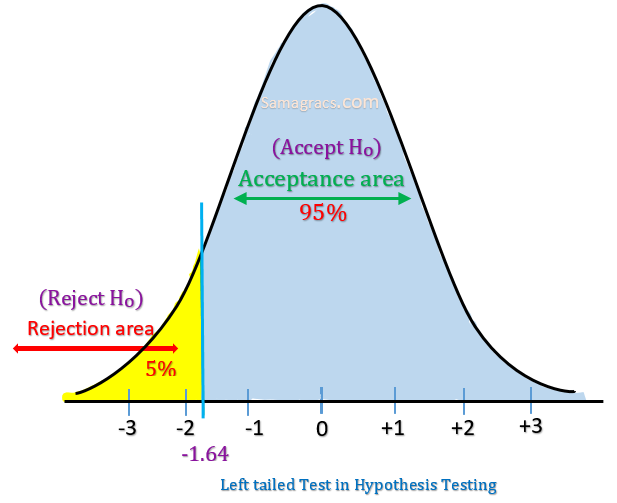
| ✰ A Left one-tailed test is used when the population means is lower than some hypothesised value of sample mean. Example: H0: = (Girls are not less than boys in performance). Ha: < (Girls are less than boys in performance). ✰ In this case, the Null Hypothesis is rejected when Girls are less than (<) boys in ✰ If the significance level is 5%, then the rejection region will be equal to 0.05 of area in the Left-tail of curve. ✰ In Left one-tailed test , there is one rejection region only on the left tail of the curve as shown below: ✰ Mathematically we can state: Acceptance Region A: Z >= -1.645 Rejection Region R: Z <= -1.645 |
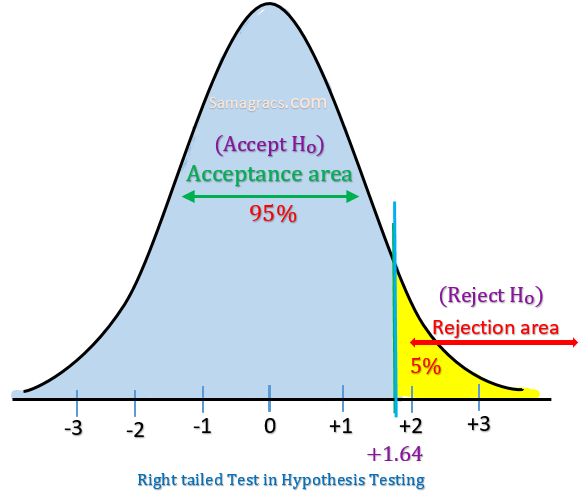
Right-tailed test
| ✰ A Right one-tailed test is used when the population means is greater than some hypothesised value of sample mean. Example: H0: = (Girls are not less than boys in performance). Ha: < (Girls are less than boys in performance). ✰ In this case, Null Hypothesis is rejected when Girls are better than (>) boys in performance. ✰ If the significance level is 5%, then the rejection region will be equal to 0.05 of area in the right-tail of curve. ✰ In Right one-tailed test , there is one rejection region only on the right tail of the curve as shown below: ✰ Mathematically we can state: Acceptance Region A: Z <= 1.645 Rejection Region A: Z >= 1.645 |
E. Normal Distribution:
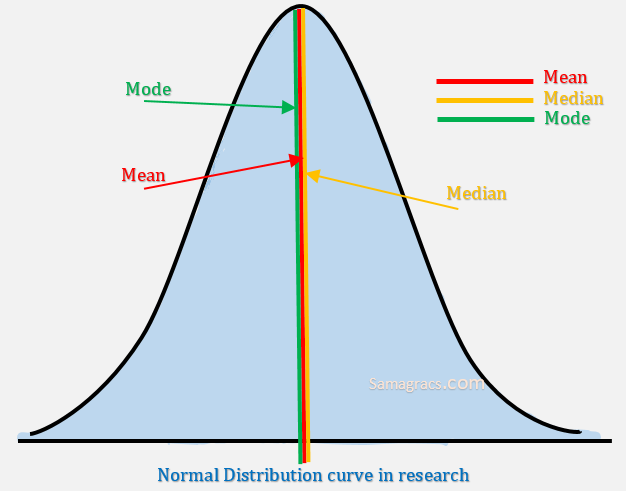
| ✰ Normal distribution, also called Gaussian distribution is a bell-shaped frequency distribution curve. Normal distribution is symmetrical on both side of its mean. Properties: • It is in shape of bell curved. • No skewness. • The distribution is symmetric about mean, it means half the value fall below mean and half above mean. • In normal distribution, mean, median and mode carry the same value. |
Normal Distribution curve in research
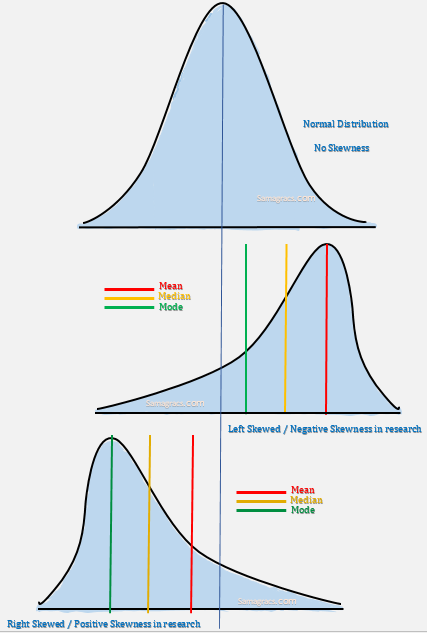
Example of No Skewness/Left Skewness/Right Skewness
Skewness:
| ✰ The skewness represent different aspect of normal distribution. It is the degree of deviation from the symmetrical bell curved or normal distribution. The term skewness means lack of symmetry from normal distribution. |
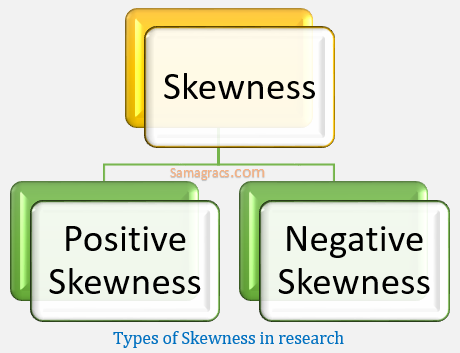
There are two types of skewness:
1. Positive skewness
2. Negative skewness
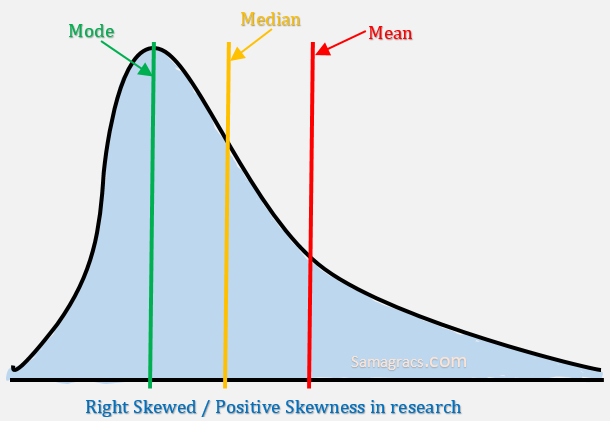
1.Positive skewness
| ✰ It is also called Right skewed. In positive skewness, right hand tail is longer than left hand tail. ✰ The value of mean is greater than of value of median and value of mode. Mode<median<mean |
Right Skewed/Positive Skewness in research
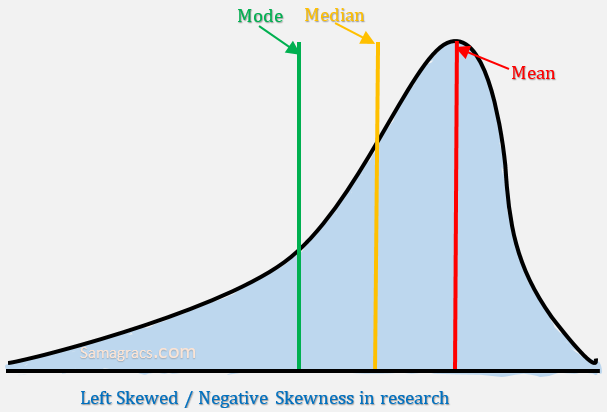
2. Negative skewness
| ✰ It is also called Left skewed. In negative skewness, left hand tail is longer than right hand tail. ✰ The value of mean is less than of value of median and value of mode. Mode>median>mean |
Left Skewed/Negative Skewness in research
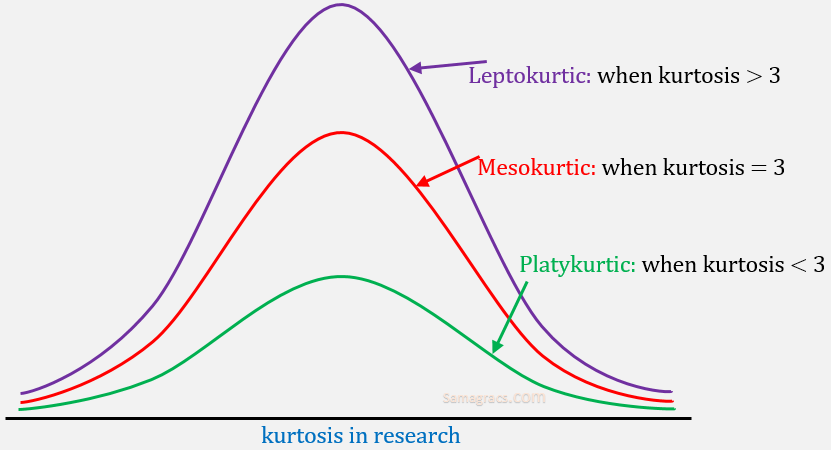
Kurtosis:
| ✰ Kurtosis is all about tail shaped of normal distribution. It is a measure of whether data are heavy tailed or light tailed in comparison to tail of normal distribution. The kurtosis value can range from 1 to +∞ . The kurtosis of normal distribution is 3. |
Three situation are there in kurtosis:
| 1. Platykurtic: when kurtosis < 3, Tails of distribution are thicker and centre of distribution are thinner (less peakedness or flat). It is also called negative kurtosis. 2. Mesokurtic: when kurtosis = 3, 3. Leptokurtic: when kurtosis > 3, Tails of distribution are thinner and centre of distribution are thicker (more peaked). It is also called positive kurtosis. |
Kurtosis in research
4.Hypothesis Examples:
Research question /Hypothesis and Null Hypothesis
You Should Learn Procedure for hypothesis testing or Better Performance
You should learn previous year solution on this topic. GO Below ☟
| Research Content : |
- Introduction of Research
- Objective of Research
- Desirable Motivation
- Characteristics of research
- Positivism or postpositivism
- Classification of research
- Fundamental research
- Applied research
- Difference between fundamental and applied research
- Quantitative research
- Qualitative research
- Descriptive research
- Correlational research
- Exploratory research
- Explanatory research
- Experimental Research
- True experimental VS Quasi-experimental
- Inductive Research
- Deductive Research
- Inductive Research VS Deductive Research
- Conceptual Research
- Empirical Research
- Conceptual Research VS Empirical Research
- Structured Research
- Unstructured Research
- Ex-post facto Research
- Historical Research
- Analytical research
Hypothesis Testing
Hypothesis Testing